Dashboard Overview
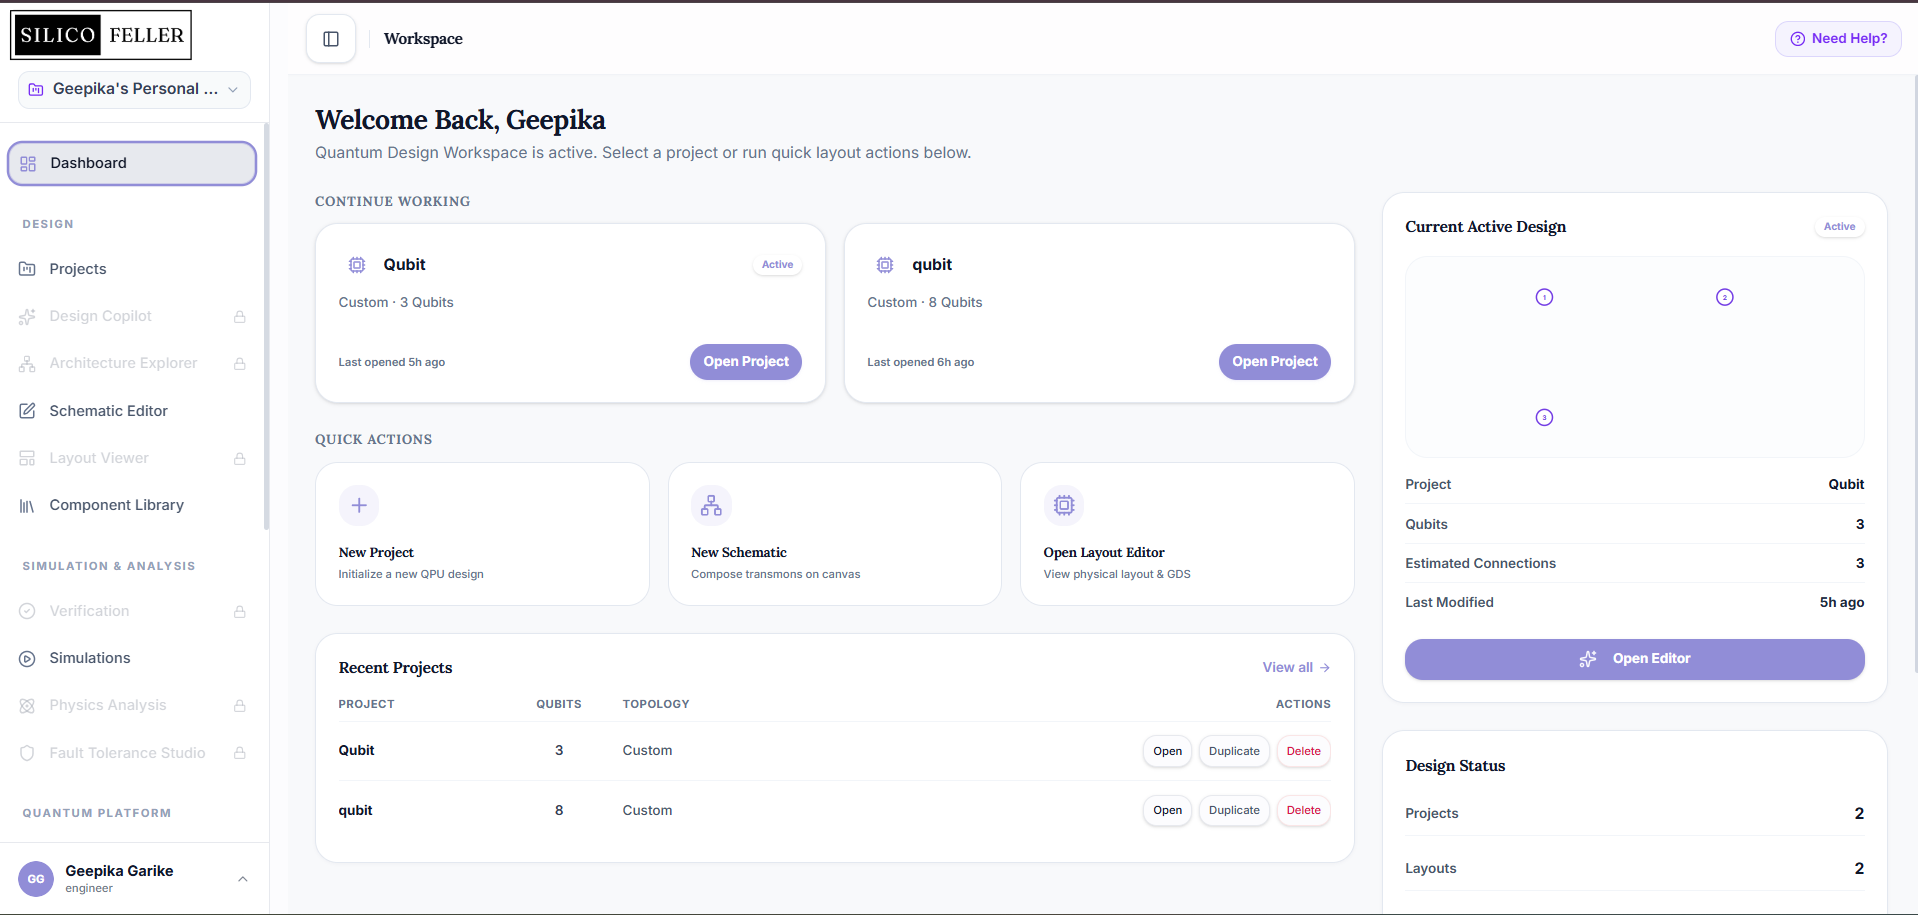
The Workspace Dashboard is the central home screen of Qubit-Pro. It displays your active projects, recent simulations, and quick shortcuts.
Key Sections of the Dashboard
Projects Section:
Shows a list of all your quantum chip design projects.
Each project card has a dynamic CAD preview showing the arrangement of qubits on the substrate.
You can see the project name, description, qubit count, topology type, and when it was last modified.
You can click Open to work on a project, Duplicate to make a copy, or Delete (trash icon) to remove it.
Simulations Status:
Displays a list of recent physics simulations run on your chip designs.
Shows status tags for each simulation:
Running: The simulation is currently processing on the backend servers.
Completed: The simulation has finished successfully.
Queued: The simulation is waiting for hardware resources.
Quick Start Panel:
Contains buttons to quickly perform common tasks like creating a new blank project, importing an existing design, or launching the Design Copilot.
Recent Activity Feed:
Shows an audit trail of modifications made by you or your team members, such as “Ada Lovelace edited Qubit Q0 frequencies” or “v1.0 Snapshot created.”
What this means: The dashboard gives you an instant overview of your workspace, letting you quickly open designs or monitor long-running simulations.